
Introduction
Developed, student - tested, and refined during a 33 year career at Cal Poly, San Luis Obispo, the experiments cover thermodynamic properties, processes, laws, and cycles, as well as heat transfer by conduction, convection, and radiation. Each experiment contains a short video clip, a complete write-up, and actual data in an Excel file. The video and data files are on a CD bundled with the book.
Features in Physical Experiments
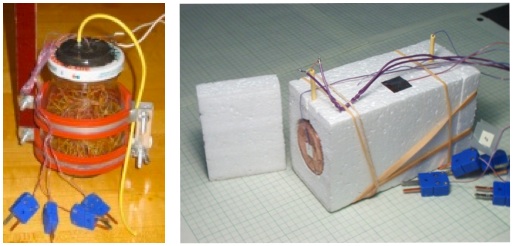
There is a real physical flavor with these experiments – thus the leading word in the title of this work. Each experiment write-up contains clearly reproduced photos, including many close-ups, all with extensive captions that completely describe the hardware. There are 180 photos and 85 illustrations. Furthermore, the videos show the same hardware in operation and the Excel data come from the same hardware.
During the development, student-testing, and refinement of the experiments, earlier designs preceded those presented in this collection. Some of these early designs were developmental and some just didn’t work. Important lessons can be gained from these early designs and, where instructive, these designs are covered.
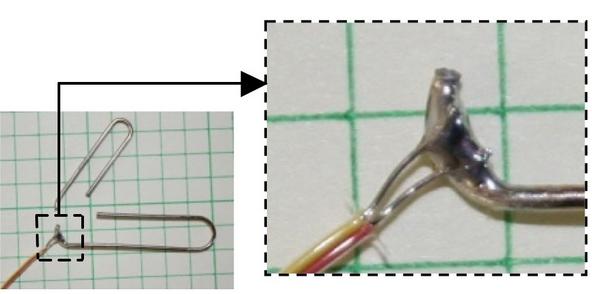
One developmental design was a paper clip cycled in torsion until fracture. A thermocouple, soldered adjacent to the fracture location, indicated a temperature rise of 21.8 °C. This simple experiment was the first in a series of designs that ended with the copper cold working experiment and the verification of the first law of thermodynamics.
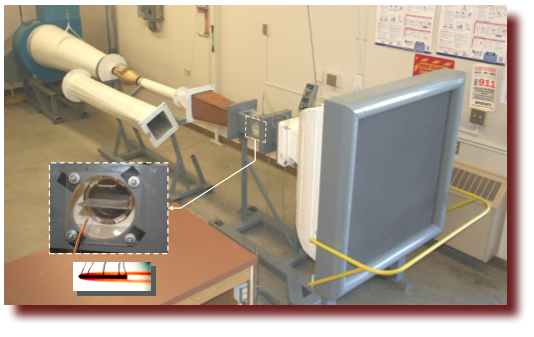
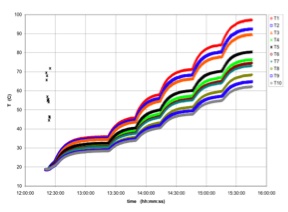
In one experiment, faulty data were discovered. This led to the close examination of the equipment which revealed two bad channels in the digital data acquisition system. A simple thermocouple test was devised to check these two channels, which confirmed the problem. This allowed the removal of these two temperature data series from the complete set. However, sufficient data remained to obtain a final result without having to repeat the four-hour experiment. All of this is explained. Students will use these data and obtain a final result that differs by 5.4% from the published value.
In the enthalpy of fusion for water experiment an unworkable early design led to an entirely different design that produces a final result that is only 1.5% off the published value. Both designs are covered.
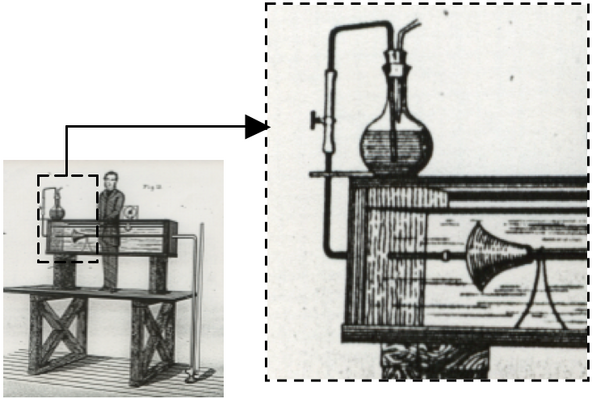
Historical experiments also contributed to the current experiments. Reynolds’ 1883 experiment that led him to formulate the famous Reynolds number has a design feature that is incorporated into equipment in two current experiments. Reynolds’ historic experiment and illustration are explained and his design feature credited. Three additional historic experiments from Joule (1843), Hirn (1865), and Mallock (1889) provide the impetus for three other experiments. Descriptions and explanations of the pioneering experiments naturally lead the student into the descriptions and explanations of the present experiments.
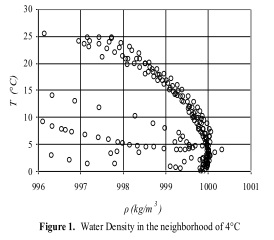
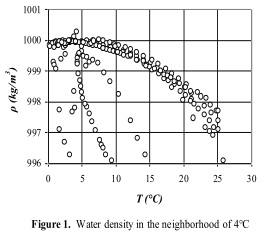
Even the opening chapter – “The Excel Data” – has a physical flavor with the use of actual data from one experiment. Using 382 student-collected data points, the information is displayed six different ways to illustrate the best practice for making charts.
An added benefit of 15 of the 25 experiments is the simplicity of the equipment. These experiments can be constructed in about one day and at a cost under $50 (instrumentation excluded). For schools that fabricate any of these experiments, the write-ups and videos can still be used. For this purpose, and where useful, equipment construction details are given. Furthermore, these construction details should answer questions arising from the student’s curiosity about the hardware – or help instill a curiosity, if this is missing.
Nine thermodynamic experiments contained in this collection are currently integrated into Cengel & Boles “Thermodynamics, 5th & 6th Editions” published by McGraw-Hill. M-H advertises their textbook as a “worldwide best seller.” Dr. Mullisen (the author) licensed the 9 experiments to McGraw-Hill, but retained copyright ownership. The license has recently expired. Now, with the addition of 15 heat transfer experiments and another thermodynamic experiment there are 25 experiments. Additionally, this work contains an opening chapter on data reduction and chart making plus four appendices.
In the video clips the equipment is carefully described and then operated as a demonstration. Data have been collected during actual testing and these data are found in the Excel files. A complete write-up is provided with annotated photographs of the equipment and the historical background pertaining to the experiment. A complete analysis necessary for the data reduction is also included. A required portion in the write-up directs the student to the reduction of the data and usually also requires plotting the results and finding empirical correlations.
For all of the experiments the final results are compared against information found in heat transfer and thermodynamics textbooks. Most of the experiments give final results that come within 10%, or closer, to these published values. Two experiments have final results that are only 0.9% off the published values; two other experiments come in at 1.0% and 1.5%. This check provides verification of the experiment and a sense of accomplishment and completeness for the student. Furthermore, it gives the student a physical check on material developed in the textbooks. Nothing in the virtual world can provide such a check.